The 2018 Brandywine-Christina State of the Watershed Report:
An examination of a watershed that provides great value to Pennsylvania and Delaware
By: Jillian Young, Graduate Research Assistant, University of Delaware Water Resources Center
The recently-released Brandywine-Christina State of the Watershed report provides an overview of the watershed, along with the current trends and conditions of several indicators of watershed health. The report was a collaborative effort of several partners in the Brandywine-Christina Watershed, including: The Brandywine Conservancy & Museum of Art, Stroud Water Research Center, Natural Lands, Brandywine Red Clay Alliance, The Nature Conservancy in Delaware, the University of Delaware Water Resources Center, and the Chester County Water Resources Authority. The report was funded by the William Penn Foundation through the Delaware River Watershed Initiative.
The Brandywine-Christina Watershed comprises four smaller watersheds: Brandywine Creek, White Clay Creek, Red Clay Creek, and Christina River. Together it spans 565 square miles and is home to over 600,000 people. The watershed produces up to 100 million gallons of water per day to northern New Castle County and southeastern Pennsylvania.

A map showing the Brandywine-Christina Watershed and sub watersheds.
About 56% of the watershed lies in Pennsylvania, while the majority of the population in the watershed is in Delaware. As a whole, the watershed is a critical piece of the economy and provides over 100,000 jobs and brings in $4.9 billion annually in economic activity. It is essential for human health and the economy to restore and protect the Brandywine-Christina Watershed.
The Brandywine-Christina State of the Watershed report describes the many distinct characteristics of the watershed, summarizes numerous sources of indicator-specific data, and discusses the overall health of the watershed. The report utilizes several indicators to determine watershed health, including annual precipitation, number of impaired streams, nutrients and bacteria, salinity, and macroinvertebrates.

A graph representing annual precipitation at the Wilmington Airport, DE. Data is from the National Weather Service.
The annual precipitation from 1960 to 2018 has increased from a range of 40-45 inches to approximately 50 inches. There has been a slight increase in average air temperature, with the number of days over 90 degrees Fahrenheit more than doubling.
Delaware’s portion of the Brandywine-Christina Watershed has 116.5 miles of impaired streams for bacteria and 51.4 miles of impaired streams for nutrients. In Pennsylvania’s portion, there are 308.1 miles impaired for sediment, 135.5 miles of impaired streams for nutrients, and 68.7 miles impaired for bacteria.
Dissolved oxygen levels have increased in the watershed as a whole. Phosphorus and nitrogen levels have slightly improved but there is still progress to be made. Total suspended sediments, a known problem caused from many sources, like agriculture and impervious surfaces, have declined in the watershed. Salinity has increased in the watershed, causing concern, especially related to the impact of winter road salting. Bacteria levels, measured in Pennsylvania as fecal coliform and Delaware as Enterococcus, are continually below the swimming threshold during the winter, but exceed levels during the summer.
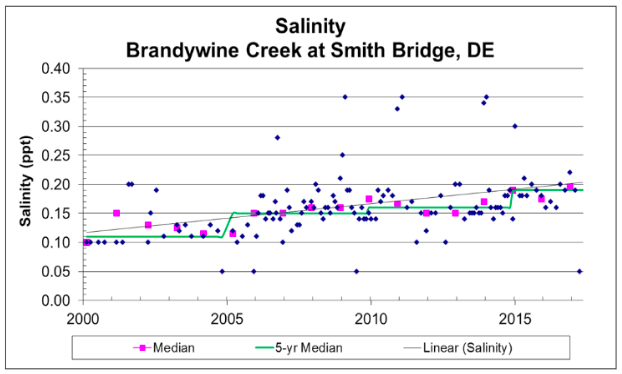
A graph showing the increasing rate of salinity at Brandywine Creek at Smith Bridge, DE from 2000 to 2017.
The Brandywine-Christina watershed land use is composed of urbanization, agriculture, and natural lands, such as forests and wetlands. The upper portions contain more agriculture while the lower portions are more urbanized. Within the watershed, the Brandywine Creek Watershed has the greatest percentage of protected land at 31%.
In order to protect stream health, restoration efforts and riparian buffers are needed throughout the watershed. Many of these practices are supported by the US Department of Agriculture Farm Service Agency and Natural Resources Conservation Service. In Pennsylvania, there are 26 miles of riparian buffers, 10.3 miles of stream fencing, and over 7,100 acres of farmland adopting conservation plans. Delaware has 10 acres of tree plantings, 1,600 linear feet of stream fencing, and over 4,300 acres of land adopting nutrient management plans.

A map showing the land cover in the Brandywine-Christina Watershed from 2010.
Macroinvertebrates are used as a reliable source to examine water quality health. A monitoring program has been established by the USGS and the Chester County Water Resources Authority in Chester County, PA. The Delaware Nature Society is conducting a monitoring program in Delaware. The monitoring sites indicate that there is a span of good, fair, and poor water quality throughout the watershed.
The Brandywine-Christina State of the Watershed report summarizes additional findings on birds, freshwater mussels, and fish. The report also examines watershed modifications, water supply demand, and wastewater discharge levels. To delve further into these findings and those discussed above, the report can be downloaded online.